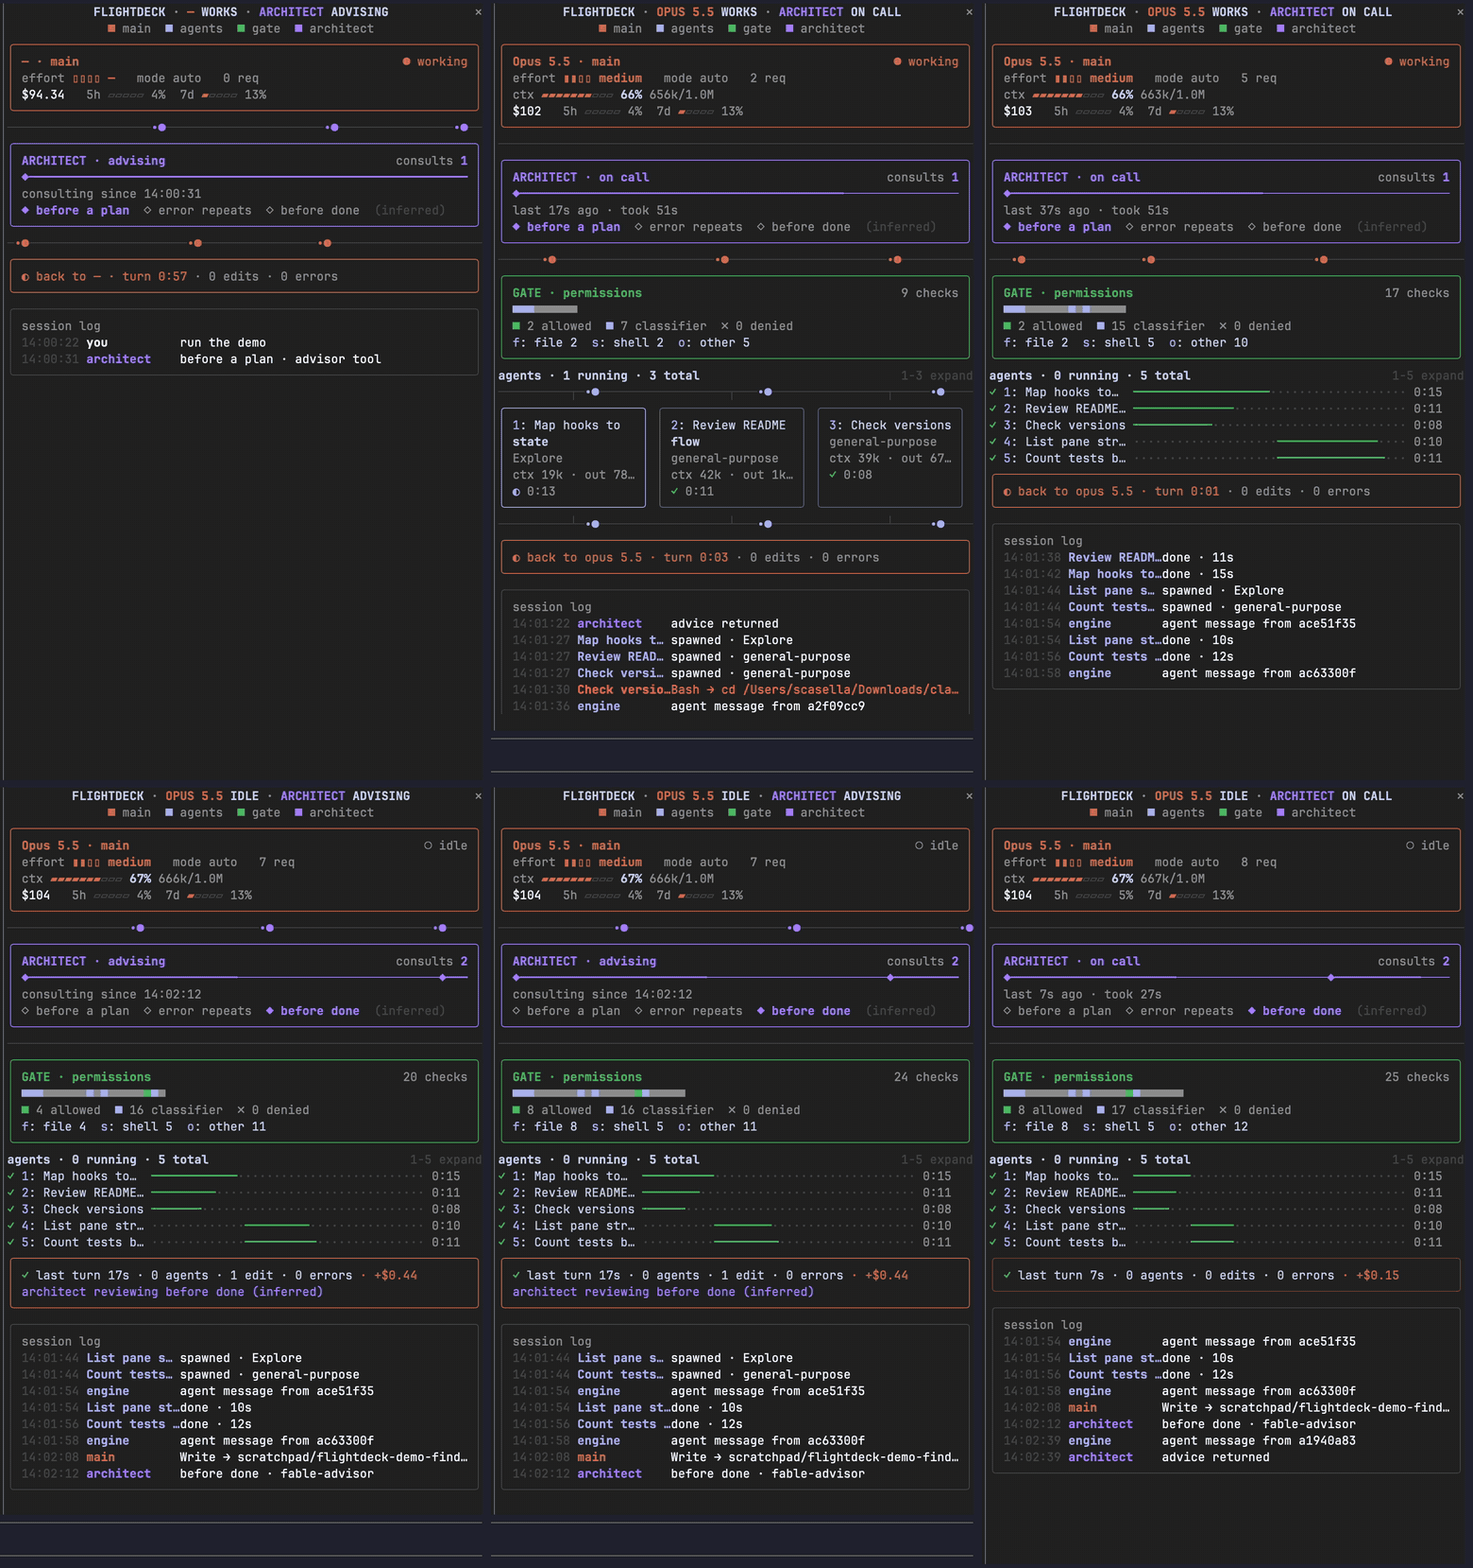
cctop is an htop/btop-style terminal dashboard for a running Claude Code session. It shows the internals Claude Code doesn't — context fill and when the next compaction hits, tokens and cost with cache-hit ratio, rate limits with an exhaustion forecast, what the current turn is waiting on, per-tool latency and how much context each tool pushed, subagents and MCP servers, touched files — on one page, in real time, in a right-hand split while you keep working on the left.
Type /cctop in a Claude Code session and it appears — docked inside
Claude Code as a panel when the build supports it, otherwise attached as a
terminal split beside it. One command either way; see
Two ways to see it.
What it looks like
 cctop  claude-sonnet-5 · turn 6 · 9h 25m · ENDED 23:28 · /home…  ● COMMITTING 8h 40m
 1: ctx 14% · 425k left     2: 5h — · no status line   3: cache 59m≈ · 1h TTL
 4: spend $18.7 · ≈$1.01/h  5: ✓ python3 -… 9h01 · re… 6: 140 calls · 6 err
 ▸ `cd lorem_ipsum_dolor_sit_amet…` blocked the turn… — queue: 'run       a: advisor
   builds and test suites longer than a …  LATER · turn 6
─── events ─────────────────────────────────────────────────── 0: home  ·  ? keys ───
  23:29  api     cost-state $18.75 · api 22:14 · retries 0:00
  23:29  note    /clear · continued in a new session
  23:28  coach   LATER A10 fired · `cd lorem_ipsum_dolor_sit_amet…` blocked the turn…
  23:28  tool    Bash ✓ 49
  23:28  tool    Bash git commit -m "$(cat lorem_i lorem lore lor lorem_i lorem_ip l…
  23:27  tool    Bash ✓ 16
  23:27  tool    Bash git push lorem_ lore 2>&1 ▶
  23:27  tool    Bash ✓ 32
  23:27  cost    model opus-5 → sonnet-5
  23:27  tool    Bash git commit -m "$(cat lorem_i lorem_ipsu lorem_i lore cctop lor…
  23:25  tool    AskUserQuestion ✓ 83
  14:49  tool    AskUserQuestion ▶
  14:49  api     API error: invalid_request 400
  14:49  compact compacted auto 567k → 230k in 1:20
  14:48  note    interrupted after 6 calls
  14:47  api     API error: request failed
  14:46  tool    TaskUpdate ✓ 5
  14:46  tool    TaskUpdate completed ▶
Claude Code keeps running in the left pane; cctop attaches to it from the right. A header that never moves and one body that fills the rest: the identity line with the phase cell (● COMMITTING 8h 40m) at the right; six cells — context, limits, cache, spend, work, tools — three per row from 80 columns and two below, each a target whose digit opens its body in place; the act line, the coach's slot, wrapped rather than cut, a for the advisor; the rule line naming the open body, 0 the way home, ? its key map; then the body — 1 above opens the context body, the five slices of the window as bars in order of what you can do about them, the counters and what the light says; 4 the spend with its provenance and the token mix; 6 the by-tool table with the agents and the team. Enter opens the body's full-screen panel (Esc back), and inside a panel the digits 1–9 still switch panels: inside panels 1 and 2 Enter opens the turn ledger; inside panel 6 it opens the agents view — one row per subagent with its model, time, tokens, priced cost, what came back (ret) and what was wasted, with the reason (failed, killed, no ret, idle), workflow runs folded into one row each, and the team the session leads as a second group — one row per teammate with its context, tokens, its own cost (Claude Code's own figure once it ended) and turns — sorted with s/S. Press c for the coach view: the same four lights as a 56-column card with the nudge, what is next and what is snoozed.
Two ways to see it
/cctop picks one automatically — it never asks you to choose.
Terminal view. The dashboard above, running as its own
process (cctop run) in a split of your terminal multiplexer (tmux, zellij,
WezTerm, Kitty, iTerm2). This is what /cctop falls back to, and what you get
from cctop split directly. See Install & attach.
Panel view. On a Claude Code build with function hooks enabled, /cctop
docks the same dashboard inside Claude Code, above the prompt, drawn in
Claude Code's own frame and colour style — no multiplexer needed. Its
Overview is Console above, row for row — the cells, the act line and
0: home are the engine's own clickable chrome, the digit each draws being
its hotkey; its Coach view is the card the TUI's c shows, with buttons:
╭coach ─ opus-5 · turn 5 ──────────────────────────────────╮
│ PLANNING · 5c +490 · silent 13m · ▸ steer window         │
│ ──────────────────────────────────────────────────────── │
│ ◐ context  720k ▇▇▇▇▇▇▇▁▁▁ 72% · ≈$.37/call              │
│ ○ cache    warm 1h00 (1h) ≈                              │
│ ○ limits   — no status line                              │
│ ● rework   4 blocked · edits 3 ✓ none 18m                │
│ ──────────────────────────────────────────────────────── │
│ ▸ rm is denied by your rules                             │
│   tell Claude the alternative — it cannot run this       │
│   NOW · fired at call 6 · +4 queued (n)                  │
│                                                          │
│ next     context-reset → next-row only · ctx 720k →…     │
│ snoozed  —                                               │
╰──────────────────────────────────────────────────────────╯
[1 fill] [2 snooze] [3 why]
╭● rework ─ transcript ────────────────────────────────────╮
│ last check `python3 - lorem_i lorem…` ok 19m ago         │
│ fails: Denied 4 · Other 2                                │
│ rewind 1 checkpoints this turn                           │
╰──────────────────────────────────────────────────────────╯
[◐ context] [○ cache] [○ limits]  ● rework
The view bar switches between the Overview, the Coach, Tools, Agents, Files,
Events and the Advisor, the same way c/s/f/p work in the terminal
view. The Coach view is the same 56-column card as the TUI's c view — the
state line, four lights, the one nudge — with [1 fill] (writes a
prompt-class action into the prompt box; nothing is ever submitted),
[2 snooze] and [3 why], a detail frame that follows the highest light,
and the coach's one-line form pinned under the prompt. It needs
"CLAUDE_CODE_ENABLE_FUNCTION_HOOKS": "1" in the env block of
~/.claude/settings.json and /tui fullscreen; cctop pane status tells you
which prerequisite is missing. The /diff panel and the cctop panel share one
dock, so hide one to see the other — see
docs/claude-code-panels.md. Falls back to the
terminal view automatically when function hooks are off.
Bodies
The nine panels of the terminal view collapse into eight bodies on Console; every panel stays reachable with Enter.
key
Body
Answers
Enter opens
1
context
How full is the window, what it is made of and which part you can move, how many turns until autocompact
panel 1 Context
2
limits
5 h and 7 d usage as meters, reset countdown, the model's weight, will I run out before the reset
panel 3 Limits
3
cache
The countdown while the entry is warm, misses, the hit ratio, the re-write at stake if it goes cold
panel 2 Tokens & Cost
4
cost
The session's spend with its provenance (ledger, since, agents, team), the token mix, burn rate, the cost of continuing, who spent it
panel 2 Tokens & Cost
5
work
The last check, the rework light, files touched and re-read, git, the turn's counters
panel 7 Files
6
tools
Calls, errors, p50 and tokens each tool pushed into context; what is running; the agents, the team, MCP servers
panel 5 Tools
a
advisor
The nudge whole — headline, action, evidence, class — what is next and what is snoozed
the coach view
0
events
Tool / hook / permission / compaction / coach / note stream — the way home
panel 8 Events
The Advisor is rule-based (36 rules today, no model call). On the token axis: named cache misses, cache expiry, the cache countdown while a question waits, runaway tool results, re-reads, exploration runs in the main context, post-compaction re-triggers, idle MCP servers and plugins, thinking share, permission waits, long foreground commands, pasted input, chatty turns, rate-limit pacing, subagent model choice, agents whose work did not come back, hook overhead, oversized prefix, a warm model switch, a cold resume, the context cost past 200 k, an armed loop. On the outcome axis: the turn that died on an API error, Claude waiting on you, a failure cascade, a denial streak (with the allow rule), a correction streak (Esc Esc), a commit without a check, source edits with no test run, a natural boundary to /clear at, a PR without a review pass, destructive git on a dirty tree, an IDE/Claude edit collision; plan-first and long-context drift sit in the next row only. Every trigger is structural (a tool result, a denial kind, an interrupt marker, an API-error line, a git operation), never a keyword in your prompt. Its engine keeps one nudge in a slot by class (NOW › NEXT › LATER), with hard TTLs, cooldowns, an acted predicate per rule and persistent snoozes (x five turns, X the session), and the coach view (c) shows that slot beside four lights: context, cache, limits, rework.
The coach measures itself. Every fire is recorded in ~/.cctop/<session>.advisor.json (rule, class, the surface that showed it, idle time at fire, the snooze delay, acted or expired, version, model, project); cctop run --coach auto alternates sessions between an exposed arm and a control arm — fires still recorded, nothing shown — within each project / model family / version, and cctop coach-stats [--since 4w] [--replay ~/.claude/projects] prints per rule the exposed fires, acted, snoozed, reflex dismissals (x within 2 s), toggle-aways, expired-unacted, the control arm's acted-anyway rate, the false-positive rate and the causal lift, with the verdict: a rule past 20 % false positives after ten exposed fires is demoted to the next row, a precision collapse on a new Claude Code version to LATER, both applied at the next attach. The same command reports what the coach costs (socket sends, CPU, git shell-outs, hook latency). The first turn of a session shows one dim line from Claude Code's own /insights analysis of this project (medians, satisfaction, the top friction), counts and verdicts only.
Some numbers moved with the coach work: the turn count is Claude Code's own (promptId; interrupts, slash commands and task notifications no longer count, so it reads ~15 % lower than before), API-error lines no longer set the model or count as a compaction, compactions come from the compact_boundary records Claude Code writes since 2.1.263, and the autocompact threshold is the effective window − 13 000 tokens (967 k on 1M-window models) rather than 80 %.
How it works
Read-only. No changes to Claude Code. Data comes from what Claude Code already writes:
~/.claude/sessions/*.json — which sessions exist and whether they're busy
~/.claude/projects/<cwd>/<session>.jsonl — the transcript: per-response usage (deduplicated by message.id), tool calls and results, turn durations, hook timings, Claude Code's own cost-state
…/<session>/subagents/ — subagent transcripts: each agent's own calls (a message's last streamed line, a fork's replayed parent message skipped), priced into the headline cost beside the main transcript's — the cost-state already holds the agents' earlier calls, so only the calls after it are added — and, with the <task-notification> that returned each agent's result, what came back and what was wasted (cost_combined, agents_waste in the reference below; cctop query summary keeps cost main-only for one release)
~/.claude/teams/<team>/config.json and the teammates' own transcripts (…/<cwd>/<session>.jsonl, matched by the teamName on their lines) — when the session leads an agent team: each teammate's context, tokens, turns and its own cost-state, exact once it ended and priced while it runs, folded into the headline cost as team ≈$X (N of M read) and listed as a second group in the agents view; the team directory goes when the team ends and the transcripts stay, so a finished session still shows its team (team_cost, teammate_cost below)
the status-line JSON (via an optional shim) — context size and rate limits
the process tree — running commands, MCP servers, memory
/clear starts a new transcript under a new session id in the same Claude
Code process; the dashboard notices within 2 s and re-attaches to the new
session (a toast says so), and cctop query --session <old id> still answers
from the old transcript as an ended session.
Everything on screen is defined once in a metrics registry (src/metrics/registry.rs) that generates docs/metrics.md and the reference below; CI fails if either drifts.
Header
Metric
Unit
How it is computed
Sources
Caveats
Estimate
Statussession_status
enum
status from the session registry (busy/idle); WAITING when a permission request is pending; ENDED when the pid is gone
D1 D4
—
never
Turnturn_number
count
Prompts the person wrote so far, one per promptId (promptSource typed / suggestion_accepted / queued, or origin.kind human); interrupts, slash commands, task notifications, teammate messages and the compaction summary are not turns
D2
A resumed session starts counting at the resume point; before Claude Code 2.1.220 every non-meta text line counts
never
Turn elapsedturn_elapsed
ms
turn_duration.durationMs once the turn ended, else now − turn start
D2
Claude Code writes turn_duration per attempt and re-drives the same prompt (after /login) with no new user line: a response after it reopens the turn, which is live again until the next one. Panel 4 reads the turn; the header's phase word is the classifier over the last calls, and the two are labelled as such
never
Efforteffort
enum
perTurnEffort of the latest assistant line when set, else its effort, else the status line's effort.level; with thinking on/off and fast mode from the status line
D2 D3
—
never
Planplan_tier
enum
oauthAccount.userRateLimitTier (else organizationRateLimitTier) from ~/.claude.json
D12
The status line never carries a plan; keys are read, never the account's names
never
CPUprocess_cpu
%
CPU share of the claude process over the last sample interval
D5
—
never
Memoryprocess_rss
bytes
Resident set size of the claude process
D5
—
never
Context
Metric
Unit
How it is computed
Sources
Caveats
Estimate
Context sizecontext_size
tokens
cache_read + cache_write + input of the turn's last API call — everything the model read
D2 D3
The status line's total_input_tokens is preferred when the shim is installed
est when computed from the transcript alone
Context windowcontext_window
tokens
context_window_size from the status line, else the model's default window
D3
—
est without the status-line shim
Fixed prefixcontext_prefix
tokens
cache_read + cache_write of the session's first API call: system prompt, CLAUDE.md, tool schemas — lowered to the context right after any boundary that lands below it, and replaced by the /context table's own categories (all but Messages) when the person ran one and no model switch followed
D2
With a warm cache the first call is a read, so both fields are summed. The first call also carries the opening message and its attachments, so the figure overstates the fixed part (+33 % on the one ground truth); a /context run corrects it
≈ until a /context has run
Context sourcescontext_sources
tokens
One row per kind of content in the window since the last boundary: prefix · files · bash output · mcp results · agent returns · web · other results · prompts · harness · thinking · tool inputs · prose · other. Results, inputs and prompts are chars / 4 placed on the API call that first carried them and reconciled per step against Δcontext − previous output_tokens; thinking and prose are exact
D2
The rows sum to the context size by construction, so the sum is not the test — overflow_raw (what the estimates would have exceeded the size by with no reconciliation) and reconciled (what came off) are. The inspector opens with m on the Context panel
≈ on every row but thinking and prose
Tokens by sourcesource_tokens
tokens
Σ tokens_to_ctx of the calls whose results a step carried, by kind: Read and a Bash cat / sed -n / head / tail of exactly one path → files; other Bash → bash output; mcp:* → mcp results; Agent → agent returns; WebFetch / WebSearch → web; the rest → other results. Prompts: prompt_chars / 4 + 1 500 per pasted image. Harness: the attachments' tokens
D2
Scaled down on a step whose estimates exceed its exact growth; a Bash command that reads two or more files stays in bash output
≈
Per-file tokensfile_tokens
tokens
A file's Read results in the window (read: in the files row) and the bytes the model wrote into Edit / Write of it (written: in tool inputs), with its read count
D2
Relative Bash paths resolve against the session's cwd; a file read before the last boundary shows nothing — its content left with it
≈
Context referencecontext_reference
enum
Where the window's accounting starts: session-start, or the last boundary's kind with the index of its first call and the Δcontext that opened it
D2
A model switch that did not shrink the window keeps the rows in the old model's tokens and is reported as model_switch_kept
never
Context velocitycontext_velocity
tokens/turn
Exponential moving average (α = 1/5) of Δ context size per turn
D2
Turns that compacted are excluded from the average; — until a second turn has made a call (no sample is not zero growth)
Threshold = Claude Code's effective window − 13 000 tokens, the effective window being the nominal one less a 20 000-token output reserve (967 000 on native-1M models, 167 000 on 200 k windows) until a compaction has been observed for the model, then the observed value is used
est until a compaction has been observed
Context anatomycontext_anatomy
tokens
The stacked bar: prefix · tool inputs (chars the model wrote / 4, capped per call at its output less its thinking) · tool results (tokens_to_ctx, each placed on the API call that first carried it) · retained thinking (exact) · harness (attachments, each placed on the call that first carried it) · prose (exact: output − thinking − inputs per call) · unattributed (prompts and the rest of the size), since the last boundary. Every step's estimates are reconciled against that step's exact growth, Δcontext − previous output_tokens, before they are summed
D2
A boundary is /clear, a compaction, a microcompact, a resume or fork, a ≥ 30 % drop with no marker, any smaller drop with no marker, or a model switch that re-measured the window smaller; the in-flight call and results after it are not resident. Encoding: the slices are drawn in order of agency and coloured by the theme's series ramp derived from its accent — dim for what cannot change this session (prefix, harness), mid for what the next boundary drops (thinking), bright for what the person can move (inputs, results, prose) — never by the status palette, and adjacent slices alternate the fill glyph so the order survives 16 colours, NO_COLOR and the pane
≈ on every slice but thinking and prose
Harness per turnharness_tokens
tokens
Attachment tokens (reminders, injected files, listings) ÷ human turns since the last boundary
D2
rendered[].content since Claude Code 2.1.266; per-subtype ratios before
≈ before 2.1.266
Context bandcontext_band
enum
ok below threshold − 20 000 · warn inside that band (Claude Code's footer turns to "Context low") · blocked at the threshold or window − 3 000; the footer text is Claude Code's own (N% until auto-compact, N% context used when autocompact is off); precompute armed at 80 % of the window
D2 D3 D12
Overrides come from settings.json and the claude process environment (CLAUDE_CODE_AUTO_COMPACT_WINDOW, CLAUDE_AUTOCOMPACT_PCT_OVERRIDE, DISABLE_AUTO_COMPACT, autoCompactWindow, autoCompactEnabled)
never
Compactionscompactions
count
system/compact_boundary lines (exact: trigger, pre/post tokens, duration), or a PreCompact hook
D2 D4
API-error lines (<synthetic>, zero usage) never count
Before Claude Code 2.1.263 (no compact_boundary) a drop between two API calls is a compaction when the compaction summary or a /compact sits between them, or when it is ≥ 30 % on the same model with no /model between (a model switch or a handover re-measures the window)
Tokens & Cost
Metric
Unit
How it is computed
Sources
Caveats
Estimate
Cache readcache_read
tokens
Σ cache_read_input_tokens over distinct API responses
D2
Counted once per message.id; Claude Code writes one line per content block
never
Cache writecache_write
tokens
Σ cache_creation_input_tokens, split into 5-minute and 1-hour TTL from cache_creation.ephemeral_*
D2
—
never
Fresh inputfresh_input
tokens
Σ input_tokens (uncached)
D2
—
never
Outputoutput
tokens
Σ output_tokens
D2
—
never
Thinkingthinking
tokens
Σ output_tokens_details.thinking_tokens (a subset of output)
prompt_cache.ttl from the status line; else 1h if the latest call reports ephemeral_1h_input_tokens > 0, else 5m
D3 D2
—
≈ without the shim
Cache warmcache_warm
bool
prompt_cache.warm from the status line; else whether the last API call is younger than the observed TTL
D3 D2
—
≈ without the shim
Cache expires incache_expires_in
ms
prompt_cache.expires_at − now, clock-driven between status rewrites; else last API call + observed TTL − now
D3 D2
The status file is rewritten only at expiry, so the countdown runs on cctop's clock; the shim's figure is ignored when the file predates the last assistant line
≈ without the shim, or when the status file is stale
Re-cache if coldcache_recache_if_cold
tokens
prompt_cache.recache_tokens_if_cold: what the next call re-writes if the cache expires first
D3
—
never
Cache missescache_misses
count
prompt_cache.misses with miss_causes (model_changed, tools_changed, messages_rewritten, ttl_expired_1h/5m, likely_server_side…) and expected_rebuilds
D3
Claude Code counts a miss when the cache read is < 95 % of the input and ≥ 2 000 tokens were re-processed
never
Costcost
USD
Claude Code's cost-state.totalCostUSD, the latest per writing process (startTime: a --resume beside the live session or a bridge appends a second process's own running total to the same file) summed, plus a priced estimate of responses newer than the last ledger
D11 D2 D9
Subscription plans have no per-token bill; the figure is the API-equivalent list price. A ledger that covers less than the transcript's own responses are worth is another process's (this one's is still to come) and does not displace the estimate — so two readers of one file never disagree by a process, and a $0 ledger from a process that did nothing never zeroes a busy session
≈ when any part is estimated, or while the ledgers cover less than the responses
Combined costcost_combined
USD
The session's whole spend: cost-state.totalCostUSD (every process's, as cost; it already holds the subagents' calls and calls no transcript shows), plus the priced main responses after it, plus the priced subagent calls whose line timestamp is after the ledger's moment (the last timestamped line before the cost-state); with no cost-state, every main and agent call priced. Panel 2's headline, dashboard row 2, cctop report and cctop query's cost_combined
D2 D2a D9 D11
Never a subtraction: main and agents are not derived from the ledger. A fork's replayed parent message is not priced. source says ledger / priced / mixed; cost keeps the main-only meaning for one release
≈ when any priced part is non-zero
Cost by modelcost_by_model
USD
cost-state.modelUsage[*].costUSD plus estimates per model
D11 D9
—
≈ when any part is estimated
Cost per callcost_per_call
USD
context × cache-read price + median output × output price, at the current context; at the cache-write price of the observed TTL when the cache is cold
D2 D3 D9
What the next API call costs, not what the last one did
≈ (always priced from the table)
Cost per turncost_per_turn
USD
cost per call × the session's own median calls per turn (turns with ≥ 1 call), also given at 100 k of context; next 30 calls = cost per call × 30
D2 D9
The median is the session's, never a constant
≈ (always priced from the table)
Where the tokens wentattribution
ratio
Input tokens of API responses by their attributionSkill / attributionPlugin / attributionAgent / attributionMcpServer owner, machine-originated turns under idle, the subagents' own usage under agents; shares of all input tokens
D2 D6
A response without an attribution key is the person's own work
never
Agents costagents_cost
USD
Priced usage of every subagent transcript (incl. subagents/workflows/**) and its share of the session's total
D2a D9
—
≈ (priced from the table)
Team costteam_cost
USD
Σ over the teammates of the team this session leads, each from its own transcript: its cost-state.totalCostUSD where one exists, plus its priced calls after that line (all of them while it has none); members found from ~/.claude/teams/<team>/config.json, the lead's teammate_spawned results and a scan of the transcripts naming the team (teamName == session-<lead id8>). Part of cost_combined, toggled with the agents by a
D12 D2c D11 D9
A teammate's ledger already holds its own subagents and hidden calls; never a subtraction. A member whose transcript is not found adds nothing and marks the sum
≈ for a teammate's calls after its last cost-state, or all of them while it runs; ≈ and "N of M read" when a transcript is missing
Limit weightlimit_weight
ratio
/usage's weight of a call: (cached + uncached × 10 + cache-create × 12.5 + output × 50) × tier (fable 10, opus 5, sonnet 3, haiku 1)
D2 D12
Why the limit bar moves faster than dollars
never
Behaviour flagsbehaviour_flags
%
/usage's five flags as shares of the weighted usage: cache_miss (requests with > 100 k uncached tokens), long_context (> 150 k context), subagent_heavy, high_parallel (≥ 4 live sessions), cron (active ≥ 8 h); shown with Claude Code's own tip text at ≥ 10 %
D2 D1 D12
—
never
Burn rateburn_rate
USD/h
Cost of turns active in the trailing 15 minutes, scaled to an hour over the part of the window they cover
D2 D9
A turn counts from its start (clamped to the window) to its last line; windows shorter than 1 minute are treated as 1 minute
≈ (always priced from the table)
Input rateinput_rate
tokens/min
Total input tokens of turns started in the trailing 15 minutes ÷ window
D2
—
never
Limits
Metric
Unit
How it is computed
Sources
Caveats
Estimate
5-hour usagelimit_5h
%
rate_limits.five_hour.used_percentage from the status line
D3
Account-wide: other live sessions contribute
never
7-day usagelimit_7d
%
rate_limits.seven_day.used_percentage from the status line
D3
Account-wide
never
Resets inlimit_reset
duration
resets_at − now
D3
—
never
Rate limitedlimit_hit
enum
The newest API-error line with error: rate_limit (or status 429): quotaLimits.rateLimitType, resetsAt, lowPriorityRetryAfterSeconds — cleared by the next successful call
D2
Exact without the shim: Claude Code writes the 429 into the transcript
never
Spend limitspend_limit
%
rate_limits.spend_limit.used_percentage from the status line, for accounts with a monthly limit
D3
—
never
Other sessionsother_sessions
list
Live registry entries other than this one: busy/idle and how long (statusUpdatedAt)
D1
They share the rate limit
never
Projected exhaustionlimit_exhaustion
duration
Least-squares slope of used_percentage samples over the last 30 min, extrapolated to 100 %
D3
Needs ≥ 3 samples; rate-limit units are plan-specific, so tokens are not used
≈ always
Turn
Metric
Unit
How it is computed
Sources
Caveats
Estimate
Turn durationturn_duration
ms
turn_duration.durationMs system line written when the turn ends
D2
—
never
API callsapi_calls
count
Distinct message.ids in the turn
D2
—
never
API timeapi_time
ms
cost-state.totalAPIDuration for the session; per turn, gaps between a user/tool_result line and the next assistant line
D11 D2
—
≈ per turn
Retry timeretry_time
ms
totalAPIDuration − totalAPIDurationWithoutRetries
D11
—
never
Phasephase
enum
The last call's phase over the last seven calls (phase.rs: EXPLORING / IMPLEMENTING / VERIFYING / COMMITTING / PLANNING / DELEGATING / BROWSING / OPS / WAITING) and its run length; WAITING when a permission dialog, an AskUserQuestion or a Notification is pending
D2 D4
A test-class command is VERIFYING only once its output confirmed a run
never
Last checklast_check
enum
The newest test-class Bash call whose output confirmed a run (test result:, N passed, # pass…), its verdict and age; edits since counts Edit/Write calls after it
D2
—
never
Waiting on youwaiting
enum
A pending permission dialog (hook), a running AskUserQuestion / ExitPlanMode, an idle_prompt / agent_needs_input notification, or a finished turn whose last text ended with ?; with the wait's duration
D2 D4
—
never
Steerssteers
count
Human queued_command attachments folded into the turn (absorbed mid-turn); task notifications are machine turns, not steers
D2
—
never
Interruptsinterrupts
count
[Request interrupted by user…] lines with interruptedMessageId, and the output tokens the cut turns had produced
D2
—
never
Hook time by commandhook_by_command
ms
stop_hook_summary.hookInfos[].command and hook_success attachments summed per command over the session; preventedContinuation marks a blocked stop
D2
—
never
Goalgoal
enum
The last goal_status attachment (/goal): met, iterations, tokens
D2
—
never
Hook runshook_runs
count
Number of hookInfos entries in the turn's stop_hook_summary
D2
Only Stop hooks are summarised by Claude Code; other hook events need cctop install
never
Hook timehook_ms
ms
Σ hookInfos[].durationMs for the turn
D2 D4
—
never
Permission waitpermission_wait
ms
PermissionRequest → PostToolUse for the same tool_use_id, minus the tool's median duration
D4
PreToolUse fires before the prompt, so it cannot bound the wait
≈ always
Queued promptsqueued_prompts
count
queue-operation enqueue − dequeue/remove; popAll resets to 0
D2
—
never
Tools
Metric
Unit
How it is computed
Sources
Caveats
Estimate
Callstool_calls
count
tool_use blocks per tool name; MCP tools grouped as mcp:<server>
D2
—
never
Errorstool_errors
count
tool_result blocks with is_error per tool
D2
—
never
p50 durationtool_p50
ms
Median of tool_use → tool_result durations
D2 D4
Transcript timings include any permission wait
≈ until hook timings replace them
p95 durationtool_p95
ms
95th percentile (nearest rank) of durations
D2 D4
—
≈ until hook timings replace them
Last calltool_last_call
duration
now − the tool's most recent tool_use timestamp
D2
—
never
Tokens → contexttokens_to_ctx
tokens
Σ len(result text) / 4 per tool, plus w·h/750 per image (1 500 when the size is unknown); cleared results count 0
D2 D10
Heuristic; exact with OpenTelemetry. Uses the text in the transcript, not offloaded tool-results/ files (their size is shown beside it)
≈ without OTel
Input → context (IN→CTX)input_tokens
tokens
Characters the model wrote as tool inputs / 4, per tool — they stay in context like results do
D2
Bash command text is the largest share
≈ always
Bash by classbash_class
count
Bash calls by the phase classifier's class: explore / implement / test / build-lint / commit / gitread / ops / wait (Bash·test rows)
D2
—
never
Error classerror_class
count
Failed calls by Claude Code's own taxonomy (Command Failed / User Rejected / Edit Failed / File Changed / File Too Large / File Not Found / Other) plus Content Not Found, Timeout, Tool Not Found and Denied (toolDenialKind)
D2
Classified from the result text, in Claude Code's order
never
Top context consumerstop_ctx
tokens
The n single results with the largest tokens_to_ctx; ⊘ marks a result cut at a cap (truncatedByTokenCap, a persisted spill)
D2
—
≈ without OTel
Re-read taxreread_tax
USD
API calls since the result landed × its tokens × the cache-read price: what re-reading it has cost so far
D2 D9
—
≈ always
ToolSearch loadstool_search_loads
count
Deferred tools loaded through ToolSearch per MCP server (matches of its result); each load rewrites the cached prefix
D2
—
never
Agents & MCP
Metric
Unit
How it is computed
Sources
Caveats
Estimate
Agent stateagent_state
enum
running while tool_uses are pending; done when the last response ends with text and no pending tool_use; failed when the last result is an error and nothing followed for 60 s
D2a D4
—
never
Agent costagent_cost
USD
The agent's own calls priced from the table (a fork's replayed parent message excluded); — with the token count on a model the table does not know
D2a D9
—
≈ always
Agent statusagent_status
enum
<status> of the agent's <task-notification> (completed / failed / killed), by whichever of Claude Code's three deliveries it came — a user line, a queue-operation enqueue or a queued_command attachment; absent until it lands
D2
Claude Code's word beats the 60 s heuristic of agent_state where both exist
never
Agent returnedagent_returned
tokens
Length of the notification's <result> ÷ 4 (a synchronous Agent result's content ÷ 4): what came back into the session; absent until a result exists, 0 for an empty one
D2
A size, never a judgement of the result; the text is not kept
≈ always
Agent wasteagent_waste
USD
The agent's priced cost under one reason, tested in order: failed (the notification, a workflow-journal failed entry, or the 60 s heuristic without a notification), killed, no ret (completed with an absent or empty result), idle (no notification, running, no line for 5 min, nothing in flight — no tool the hook spool saw start and not finish, none the transcript shows unanswered); a finished agent without a notification is not waste, and a notification's completed outranks the journal
Σ agent_waste by reason over every subagent, and the agents classified
D2 D2a D4 D9
—
≈ always
Cold startsagents_cold_starts
count
Agents (forks excluded) whose first call wrote more cache than it read, and the cache-write dollars of those first calls
D2a D9
A cost of the design, not counted as waste
≈ for the dollars
Return ratioagents_return_ratio
ratio
Σ agent_returned ÷ Σ agent output tokens: the share of what the agents wrote that came back
D2 D2a
—
≈ always
Workflow failedworkflow_failed
count
Agents of a workflow run with a failed journal entry, by phase, each with one cause from its last API-error line (apiErrorStatus, error token) and its call count
D2a
A 429 on the first call costs ≈$0: read it with the count, not the dollars
never
Workflow failed $workflow_failed_usd
USD
Σ agent_cost of the run's failed agents
D2a D9
—
≈ always
Workflow wasteworkflow_waste_pct
%
Σ agent_waste of the run's agents ÷ the run's priced cost
D2 D2a D4 D9
—
≈ always
Workflow overheadworkflow_overhead
ratio
The run's priced cost ÷ the main thread's priced responses between the run's start and its end (or now)
D2 D2a D9
A ratio, not a counterfactual: the main thread would not necessarily have done the work cheaper; — under $0.01 of main spend
≈ always
Workflow cold startsworkflow_cold_start_pct
%
Cache-write $ of the first call of the run's cold-started agents ÷ the run's priced cost
D2a D9
A cost of the design, not waste
≈ always
Agent tokensagent_tokens
tokens
Deduplicated usage of the agent's own transcript: the last line of each message.id (subagent transcripts stream output_tokens), without a fork's replayed first message (the parent's launching response, billed in the parent)
D2a
—
never
MCP memorymcp_rss
bytes
RSS of the MCP server process
D5
—
never
MCP callsmcp_calls
count
Calls of tools named mcp__<server>__*
D2
—
never
Workflow runsagent_workflows
count
subagents/workflows/<run>/journal.jsonl: agents launched, finished (result) and failed per run; the run's agents are scanned like the top-level ones
D2a
—
never
Spawn depthagent_depth
count
Deepest spawnDepth among the agents (Claude Code caps it at 3)
D2a
—
never
Teammatesteammates
list
Members of ~/.claude/teams/<team>/config.json when this session leads the team
D12
—
never
Teammate costteammate_cost
USD
The teammate's own cost-state.totalCostUSD plus its priced calls after that line; all of them priced while it has none; — with no transcript when its file is not found
D2c D11 D9
Claude Code's own number once the teammate ended
≈ while it runs or after its ledger's moment
Teammate contextteammate_context
tokens
The teammate's current context: the input of its last API call, as Panel 1 computes the lead's
D2c
—
never
Teammate tokensteammate_tokens
tokens
Deduplicated usage of the teammate's transcript (one figure per message.id), as the lead's Panel 2
D2c
—
never
Teammate turnsteammate_turns
count
Turns of the teammate's transcript, human / machine: a <teammate-message> starts a machine turn
D2c
—
never
Teammate stateteammate_state
enum
active (isActive: true in the team config) · recent (no config; a line in the last 5 min) · ended (its file ends with a cost-state, or isActive: false) · gone (no ledger, no config, no recent line) · missing (known from the config or a spawn, no transcript found)
D12 D2c
No process mapping: liveness is Claude Code's flag or line recency
never
Teammate wasteteammate_waste
USD
The cost of the teammate's current turn under one reason: idle (alive, no API call for 5 min, no tool call unanswered in its transcript) or errored (its last response was an API-error line and nothing followed for 60 s)
D2c D9
Structural evidence of its own transcript only; no inbox, no message body
≈ always
Team wasteteam_waste
USD
Σ teammate_waste over the team
D2c D9
—
≈ always
MCP needs authmcp_auth
list
deferred_tools_delta.needsAuthMcpServers / failedMcpServers from the transcript
D2
—
never
Files
Metric
Unit
How it is computed
Sources
Caveats
Estimate
Touchesfile_touches
count
Read / Edit / Write / MultiEdit / NotebookEdit calls per file path, plus Bash cat / sed -n / head / tail reads of it
D8
A read counts when its result arrives
never
Lines ±file_lines
lines
git diff --numstat against HEAD at attach time
D7
Outside a git repo the column is empty
never
Uncommitteduncommitted
lines
git diff --numstat HEAD (added, removed, files) and the last commit Claude Code summarised (gitOperation.commit) with the edits since it
D7 D2
—
never
Rewind pointsrewind_points
count
file-history-snapshot lines in the current turn (checkpoints /rewind can restore) and the Bash writes of the turn no checkpoint covers; per file: the checkpoint version (file-history-delta, ⚠ at v8+), IDE edits (edited_text_file), stale markers (staleRecovered, staleReadFileStateHint), edit → re-read → edit churn
D2
—
never
Re-readsfile_rereads
count
Whole-file reads (Read or a Bash reader) with no Edit/Write in between; ⚠ at ≥ 3
D8
Ranged reads (offset/limit) and file_unchanged results do not count; the counter resets when the file changed under the model (an IDE edit, a stale-read recovery) and at every context boundary
never
Advisor
Metric
Unit
How it is computed
Sources
Caveats
Estimate
Estimated savingadvice_saving
tokens
seconds
Rule-specific estimate of what following the advice saves per remaining turn
D2
Ranking key; always an estimate
Coach
Metric
Unit
How it is computed
Sources
Caveats
Estimate
Context lightcoach_context
percent
The context size as % of the exact window; ○ below 150k, ◐ from 150k (or ≥ 300k on a 1M window while a turn runs), ● inside the autocompact warn band (effective window − 13 000 − 20 000) or at ≥ 300k with a clean stop available
D1 D3
Never a fixed 80 %: a deliberate 1M session sits amber
≈ when the window is the model default
Cache lightcoach_cache
minutes
tokens
Minutes of cache left (prompt_cache.expires_at, else last call + observed TTL ≈), or the re-write size when cold; ◐ inside the countdown band (the last 5 min of a 1 h entry, 2 min of a 5 m one), ● when a reply now would save ≥ 50k
D1 D3
—
Limits lightcoach_limits
percent
The 5 h window used; ◐ when the exhaustion fit lands before the reset or ≥ 80 %, ● on a rate-limit or spend-limit error line; — without the status line
D3 D1
—
never
Rework lightcoach_rework
state
Open issues: consecutive failed calls of the turn (denials excluded), corrections (interrupts, rejected calls) in the last three turns, blocked calls; else the source edits since the last confirmed test run. The figure is a state word — N open, N unchecked, ok, or — before the session has called anything — never a 0 that means healthy and no data alike. ◐ after 10 min or 14 calls unverified, two fails, a PR without a review, an uncommitted tail; ● on a cascade, a denial streak, a correction streak, destructive git on a dirty tree, a commit without a check
D1 D7
—
never
Ask your session about it
cctop query … --json exposes every number, and the bundled cctop-insights skill teaches Claude Code to use it — ask "why is my cache hit ratio low?" in the session and get numbers plus one change to make. See plugin/skills/cctop-insights/SKILL.md.
Install & attach
brew install tomstagl/tap/cctop           # currently v0.9.1; or: cargo install cctop
claude plugin marketplace add tomstagl/cctop
claude plugin install cctop               # adds /cctop and cctop-insights
/cctop                                     # opens the dashboard: panel or terminal split
/cctop is the only command you need — see Two ways to see
it for what decides panel vs. terminal, and
docs/claude-code-panels.md for how the panel
and the built-in /diff panel share one dock. If neither the panel nor a
multiplexer split can attach, /cctop prints exactly what is missing and how
to fix it — a rate-limit shim install, a terminal that isn't tmux/zellij/
WezTerm/Kitty/iTerm2, or cctop run --session <id> to run it by hand in a
second terminal.