Claude Code OpenTelemetry
OpenTelemetry hooks for Claude Code — emit spans and metrics to any OTEL collector, enabling production-grade observability for your AI coding sessions.
Claude Code Observability Stack
![]()
A comprehensive observability solution for monitoring Claude Code usage, performance, and costs. This setup implements the recommendations from the Claude Code Observability Documentation to provide deep insights into AI-assisted development workflows.
📸 Dashboard Screenshots
💰 Cost & Usage Analysis
Track spending across different Claude models with detailed breakdowns of costs, API requests, and token usage patterns.
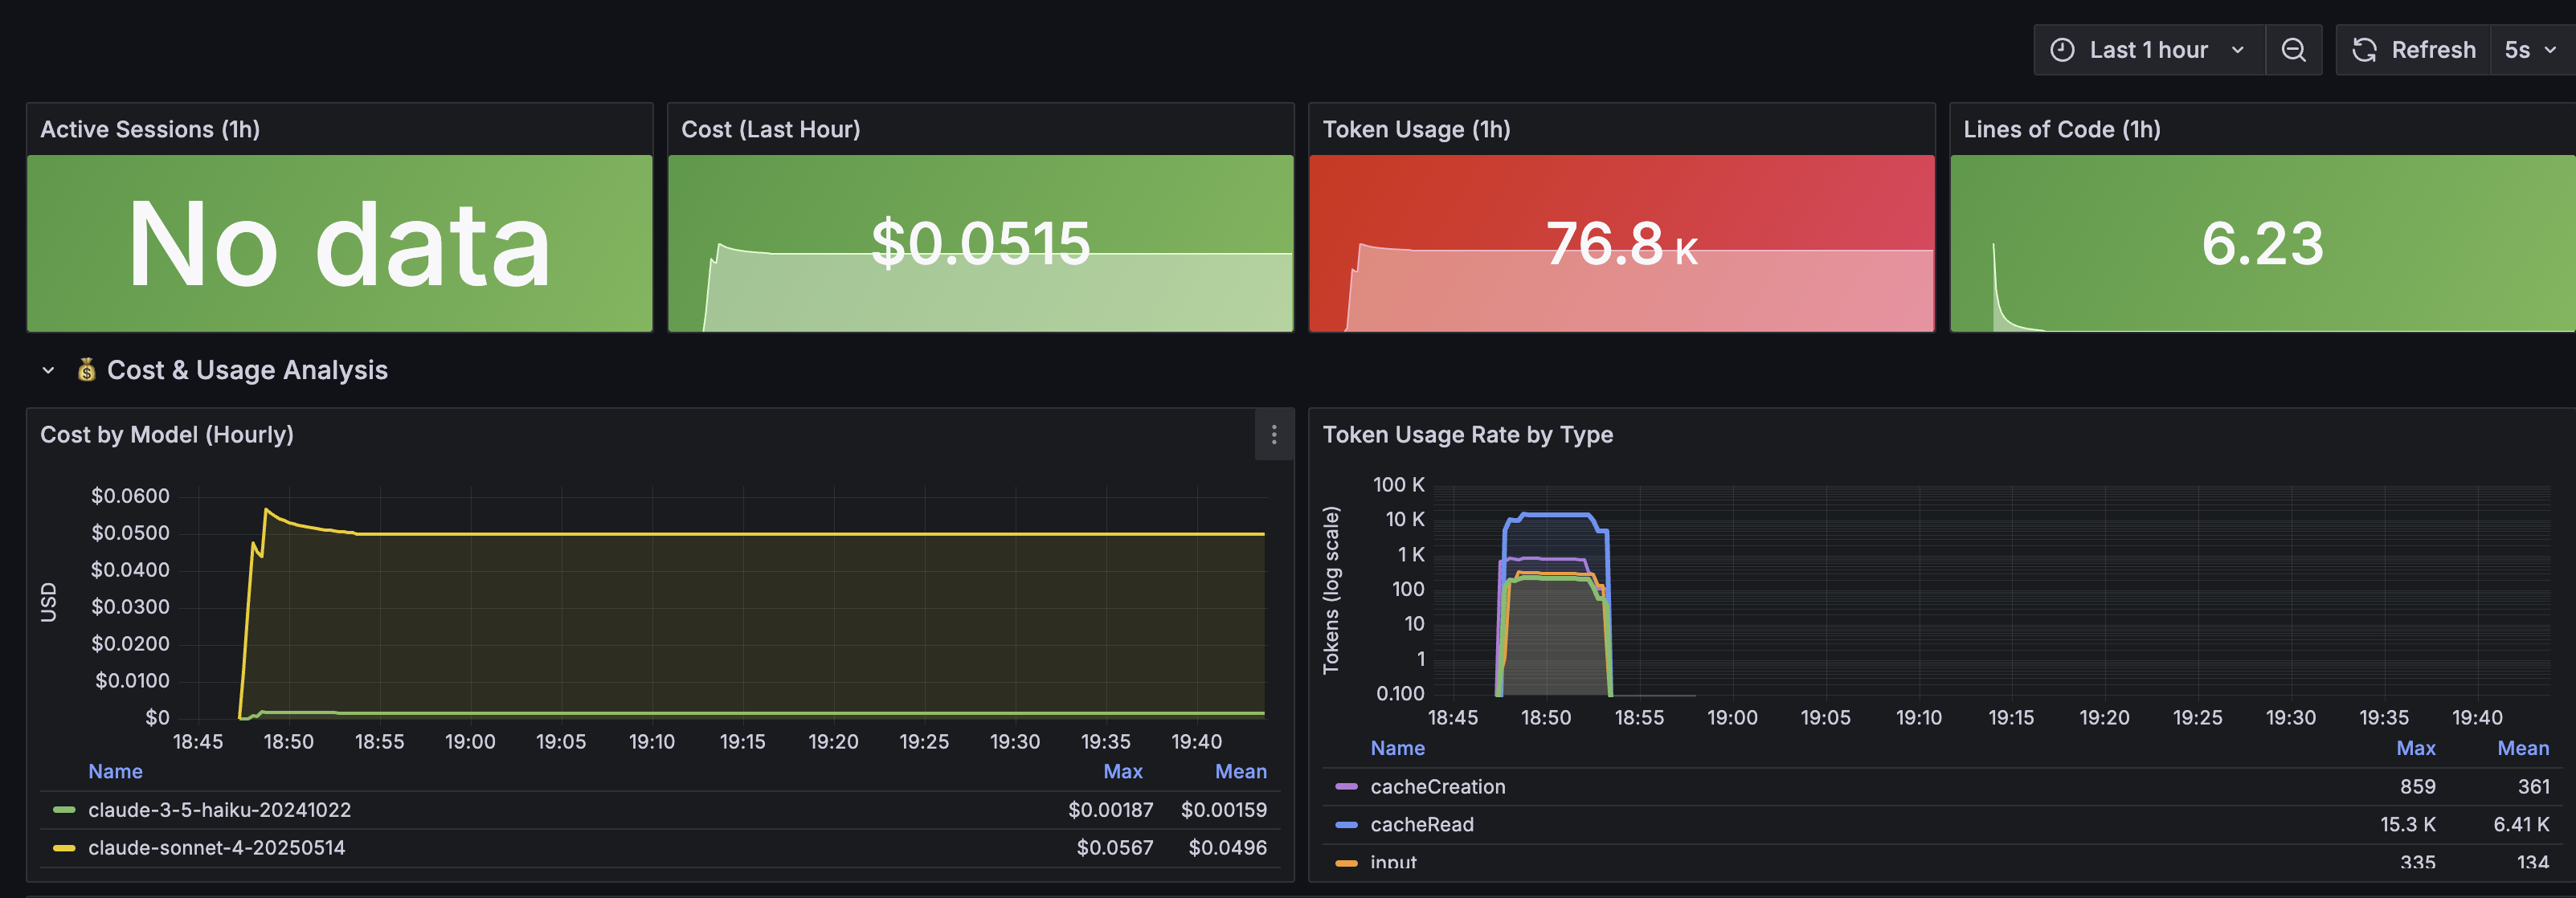
Features: Model cost comparison, API request tracking, token usage breakdown by type
📊 User Activity & Productivity
Monitor development productivity with comprehensive session analytics, tool usage patterns, and code change metrics.
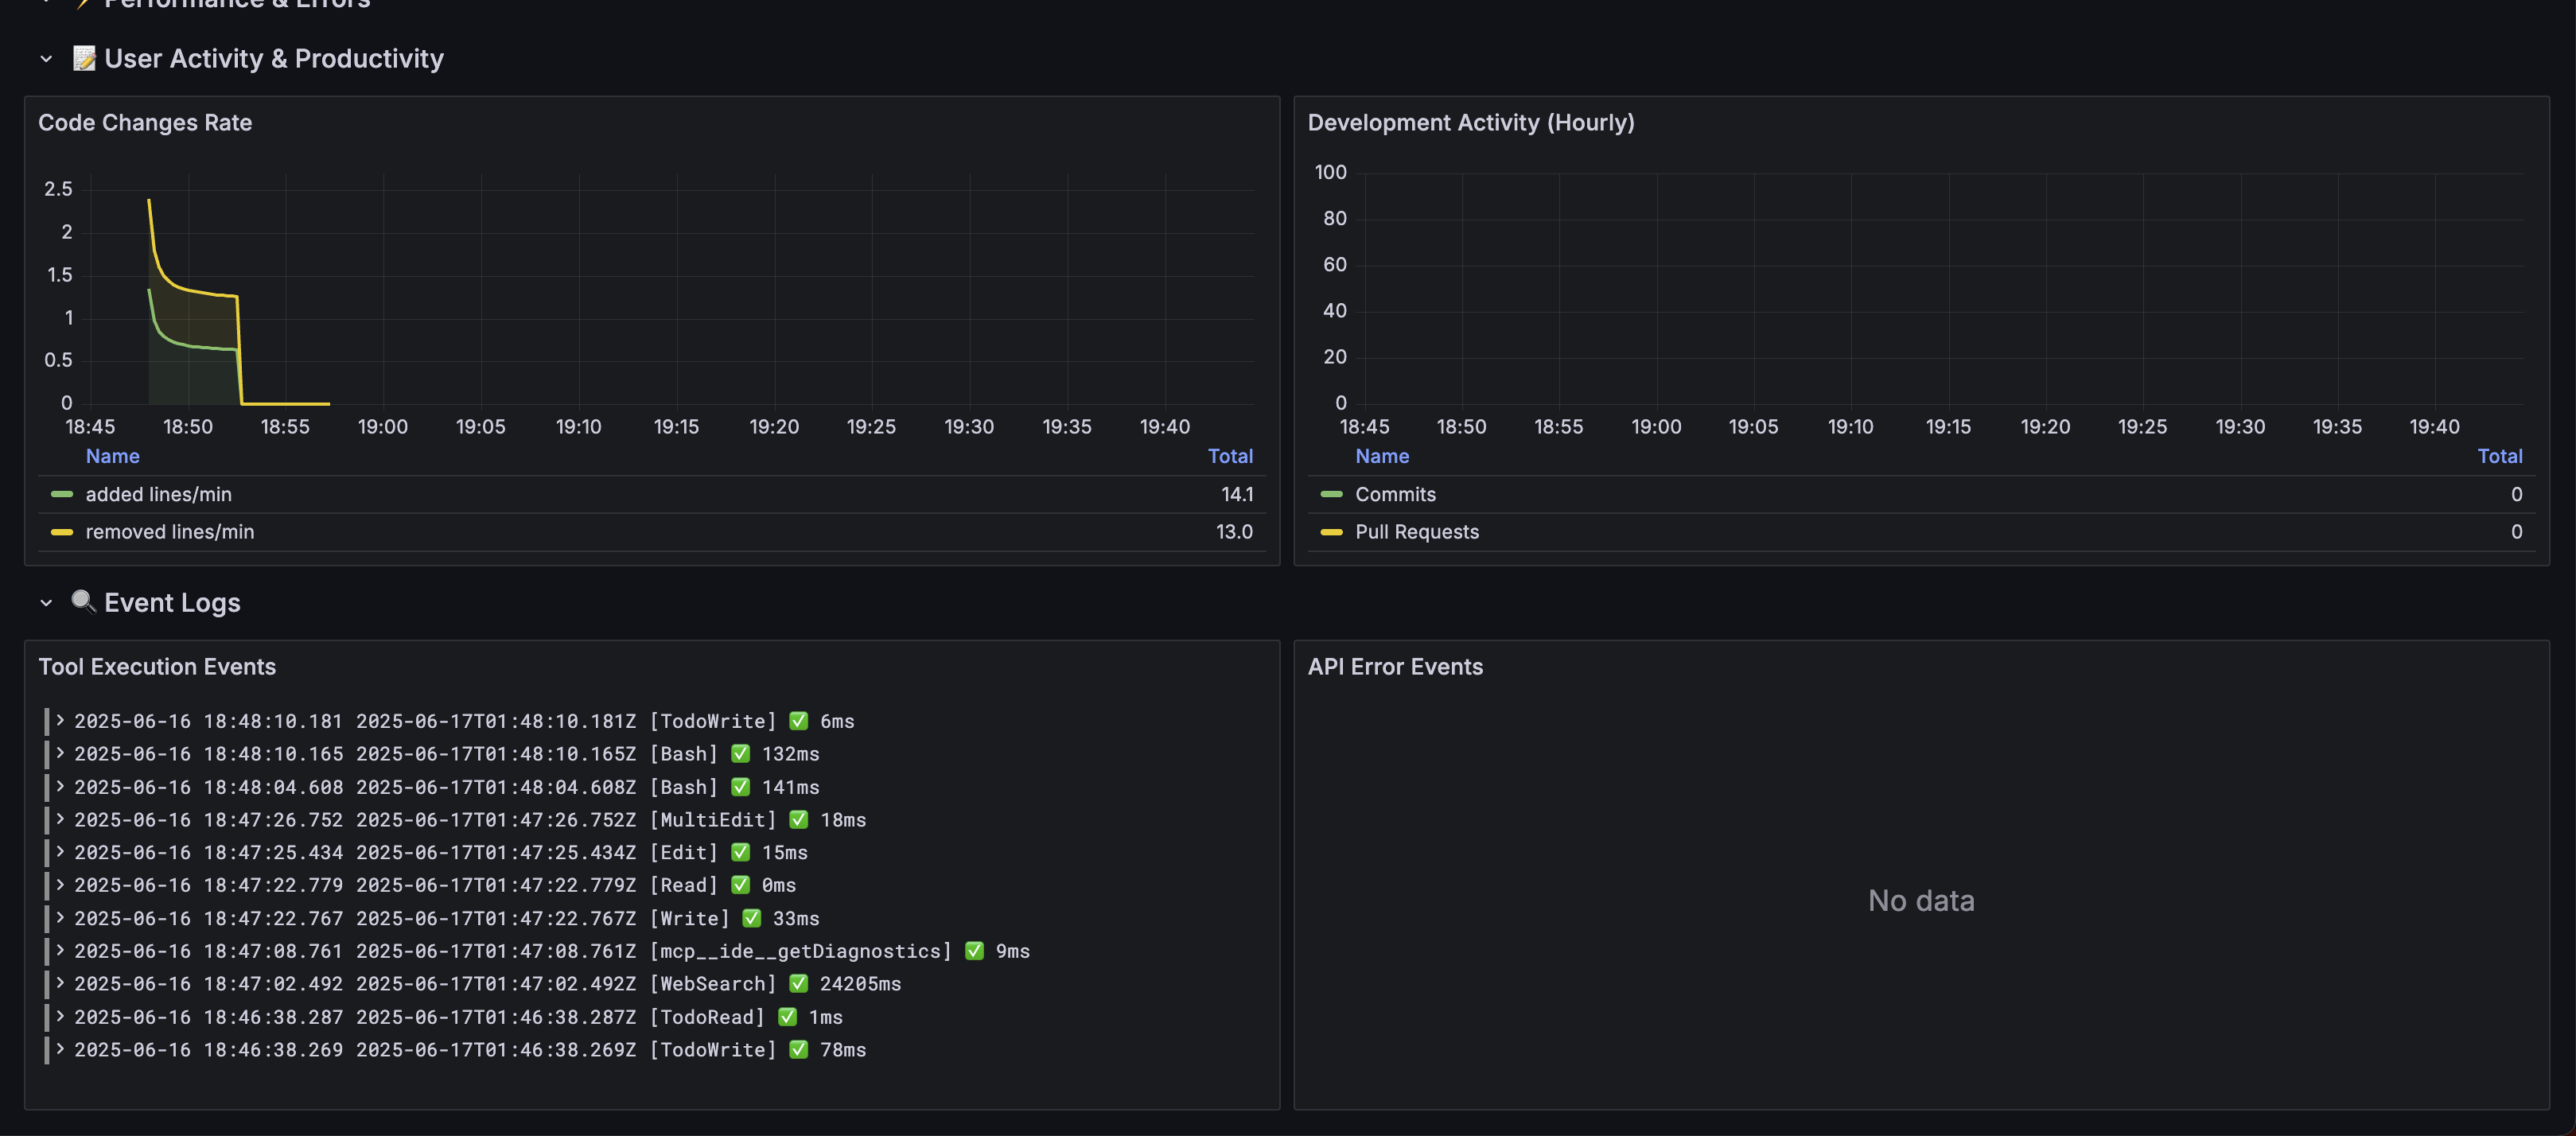
Features: Session tracking, tool performance metrics, code productivity insights
🎯 Features
📊 Comprehensive Monitoring
- Cost Analysis: Track usage costs by model, user, and time periods
- User Analytics: Daily/Weekly/Monthly Active Users (DAU/WAU/MAU)
- Tool Usage: Monitor which Claude Code tools are used most frequently
- Performance Metrics: API latency, success rates, and bottleneck identification
- Productivity Insights: Lines of code changes, commits, and pull requests
📊 Enhanced Analytics
- API Request Tracking: Monitor actual request counts by model version
- Token Efficiency: Track cost-per-token across different models
- Session Analytics: Comprehensive session and productivity tracking
- Real-time Monitoring: Live dashboards with 30-second refresh rates
📈 Rich Dashboards
- Executive Overview: High-level KPIs and trends
- Cost Management: Detailed cost breakdowns and projections
- Tool Performance: Success rates and execution times
- User Activity: Productivity and engagement metrics
- Error Analysis: Comprehensive error tracking and investigation
🏗️ Architecture
Claude Code → OpenTelemetry Collector → Prometheus (metrics) + Loki (events/logs)
                                     ↓
                              Grafana (visualization & analysis)
Components
| Service | Purpose | Port | UI |
|---|---|---|---|
| OpenTelemetry Collector | Metrics/logs ingestion | 4317 (gRPC), 4318 (HTTP) | - |
| Prometheus | Metrics storage & querying | 9090 | http://localhost:9090 |
| Loki | Log aggregation & storage | 3100 | - |
| Grafana | Dashboards & visualization | 3000 | http://localhost:3000 |
🚀 Quick Start
1. Start the Stack
# Start all services
make up

# Check status
make status
2. Configure Claude Code
# Enable telemetry
export CLAUDE_CODE_ENABLE_TELEMETRY=1

# Configure exporters
export OTEL_METRICS_EXPORTER=otlp
export OTEL_LOGS_EXPORTER=otlp
export OTEL_EXPORTER_OTLP_PROTOCOL=grpc
export OTEL_EXPORTER_OTLP_ENDPOINT=http://localhost:4317

# For debugging (faster export intervals)
export OTEL_METRIC_EXPORT_INTERVAL=10000
export OTEL_LOGS_EXPORT_INTERVAL=5000

# Run Claude Code
claude
3. Access Dashboards
- Grafana: http://localhost:3000 (admin/admin)
- Prometheus: http://localhost:9090
🖼️ Visual Guide: Check out the Dashboard Screenshots to see what your dashboards will look like!
📊 Available Metrics
Based on the Claude Code Observability Documentation, this stack monitors:
Core Metrics
claude_code.session.count- CLI sessions startedclaude_code.lines_of_code.count- Lines of code modified (added/removed)claude_code.pull_request.count- Pull requests createdclaude_code.commit.count- Git commits createdclaude_code.cost.usage- Cost of sessions by modelclaude_code.token.usage- Token usage (input/output/cache/creation)claude_code.code_edit_tool.decision- Tool permission decisions
Event Data
claude_code.user_prompt- User prompt submissionsclaude_code.tool_result- Tool execution results and timingsclaude_code.api_request- API requests with duration and tokensclaude_code.api_error- API errors with status codesclaude_code.tool_decision- Tool permission decisions
🔍 Usage Analysis
Real-time Dashboard Analysis
Access comprehensive analytics through the Grafana dashboard at http://localhost:3000:
- Cost Analysis: Real-time cost tracking with model breakdowns
- Request Monitoring: API request counts and patterns by model
- Token Efficiency: Track token usage and cost-per-token metrics
- Tool Performance: Success rates and execution time analysis
- Session Analytics: User activity and productivity insights
Key Metrics Available
- Total and per-model costs with trending
- API request counts independent of cost variations
- Token usage breakdown (input/output/cache/creation)
- Tool usage patterns and success rates
- Session activity and code productivity metrics
📊 Key Dashboard Features
💡 See Dashboard Screenshots above for visual examples
💰 Cost & Usage Analysis
- Cost by Model: Track spending across different Claude models
- API Request Tracking: Monitor actual request counts by model version
- Token Usage Breakdown: Detailed analysis by token type (input/output/cache)
🔧 Tool Performance
- Usage Patterns: Most frequently used Claude Code tools
- Success Rates: Tool execution success percentages
- Performance Metrics: Average execution times and bottleneck identification
⚡ Real-time Monitoring
- Live Metrics: 30-second refresh rate for current activity
- Session Tracking: Active sessions and productivity metrics
- Error Analysis: API errors and troubleshooting information
📋 Dashboard Sections
The Grafana dashboard is organized into sections reflecting the observability documentation recommendations:
📊 Overview
- Active sessions, cost, token usage, lines of code changed
💰 Cost & Usage Analysis
- Cost trends by model, token usage breakdown
- NEW: API request count tracking by model version
- Implements cost monitoring recommendations
🔧 Tool Usage & Performance
- Tool frequency and success rates
- Performance bottleneck identification
⚡ Performance & Errors
- API latency by model, error rate tracking
- Performance monitoring as recommended
📝 User Activity & Productivity
- Code changes, commits, pull requests
- Productivity measurement insights
🔍 Event Logs
- Real-time tool execution events and API errors
- Structured log analysis for troubleshooting
🔧 Advanced Configuration
Environment Variables
Key configuration options (see CLAUDE_OBSERVABILITY.md for complete reference):
# Core telemetry
CLAUDE_CODE_ENABLE_TELEMETRY=1

# Exporter configuration
OTEL_METRICS_EXPORTER=otlp,prometheus    # Multiple exporters
OTEL_LOGS_EXPORTER=otlp

# Protocol and endpoints
OTEL_EXPORTER_OTLP_PROTOCOL=grpc
OTEL_EXPORTER_OTLP_ENDPOINT=http://localhost:4317
OTEL_EXPORTER_OTLP_HEADERS="Authorization=Bearer token"

# Export intervals
OTEL_METRIC_EXPORT_INTERVAL=60000        # 1 minute (production)
OTEL_LOGS_EXPORT_INTERVAL=5000           # 5 seconds

# Privacy controls
OTEL_LOG_USER_PROMPTS=1                   # Enable prompt content logging

# Cardinality control
OTEL_METRICS_INCLUDE_SESSION_ID=true
OTEL_METRICS_INCLUDE_VERSION=false
OTEL_METRICS_INCLUDE_ACCOUNT_UUID=true
Collector Configuration
The OpenTelemetry collector is configured with:
- Processors: Resource enrichment and event filtering
- Multiple Pipelines: Separate routing for metrics and different event types
- Metric Relabeling: Cardinality control for better performance
Backend Considerations
Following the documentation recommendations:
- Metrics Backend: Prometheus (time series) + optional columnar stores
- Events Backend: Loki (log aggregation) with JSON parsing
- Cardinality Management: Configurable attribute inclusion
- Retention: Configure based on your analysis needs
🛠️ Management Commands
# Stack management
make up                    # Start all services
make down                  # Stop all services
make restart              # Restart services
make clean                # Clean up containers and volumes

# Monitoring
make logs                 # View all logs
make logs-collector       # View collector logs only
make status              # Show service status

# Validation
make validate-config     # Validate all configs
make setup-claude       # Show Claude Code setup instructions
🎯 Use Cases
For Engineering Teams
- Cost Management: Track AI assistance costs by team/project
- Productivity Measurement: Quantify development velocity improvements
- Tool Adoption: Understand which Claude Code features drive value
- Performance Optimization: Identify and resolve usage bottlenecks
For Platform Teams
- Capacity Planning: Predict infrastructure needs based on usage growth
- SLA Monitoring: Track API performance and availability
- Security: Monitor unusual usage patterns
- Resource Optimization: Optimize token usage and reduce costs
For Management
- ROI Analysis: Measure productivity gains from AI assistance
- Usage Insights: Understand adoption patterns across teams
- Cost Control: Monitor and optimize AI assistance spending
- Strategic Planning: Data-driven decisions on AI tool investments
🔒 Security & Privacy
- User Privacy: Prompt content logging is disabled by default
- Data Isolation: All data stays within your infrastructure
- Access Control: Configure Grafana authentication as needed
- Audit Trail: Complete logging of all tool usage and decisions
📚 Resources
- Claude Code Observability Documentation - Complete reference
- OpenTelemetry Documentation - OTel specification
- Prometheus Documentation - Metrics and alerting
- Grafana Documentation - Dashboards and visualization
- Loki Documentation - Log aggregation
🤝 Contributing
This observability stack implements the patterns and recommendations from the official Claude Code documentation. To contribute:
- Follow the metric naming conventions in the documentation
- Update dashboards to reflect new data sources and metrics
- Test configurations before submitting changes
- Ensure all sensitive information is excluded from commits
- Update documentation for any new features or configuration changes
📄 License
This project is licensed under the MIT License - see the LICENSE file for details.
🙏 Acknowledgments
- Built following the Claude Code Observability Documentation
- Uses OpenTelemetry standards for metrics and events
- Implements industry best practices for observability stack architecture
More Hooks
Claude Code Usage Monitor
Hooks that monitor and enforce Claude Code API usage limits — track daily token spend, set budget alerts, and auto-pause when limits are reached.
Claude Hooks SDK
PHP/Laravel-style hooks SDK for Claude Code — define, compose, and test hooks with a clean API, middleware chaining, and built-in test helpers.
Plankton Quality Hooks
alexfazio's code quality hooks — automatically run formatters, linters, and type checkers after every file edit, blocking commits with quality regressions.